샘플 데이터로 엿보는 Status와 문제해결
22 Jan 2020 | Elastic Elasticsearch Elastic stack ELK stack data DB
ES status 확인
-
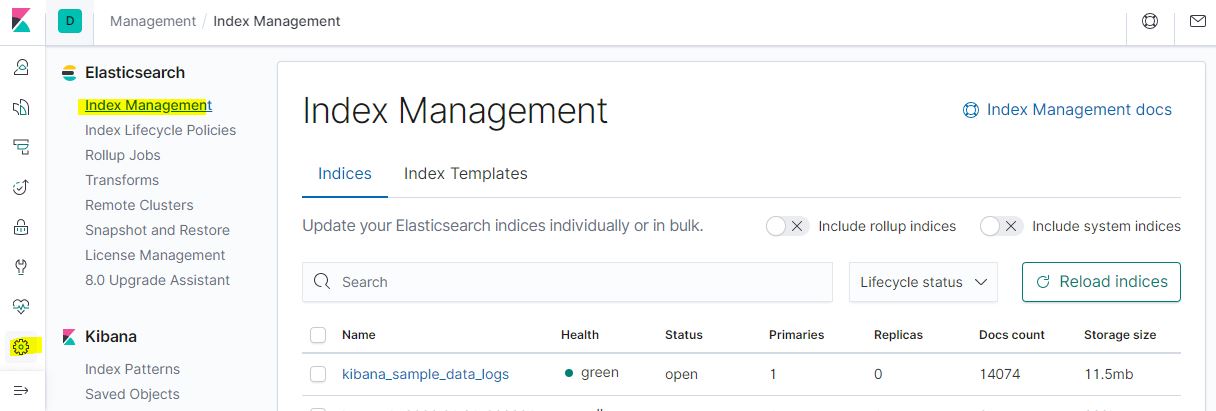
Kibana > Management > Elasticsearch하위 Index Management에서 Health 색깔 확인
- 크롬 브라우저 주소창에 입력
- cluster status : http://localhost:9200/_cat/health?v
- index status : http://localhost:9200/_cat/indices?v
- shard status : http://localhost:9200/_cat/shards?v
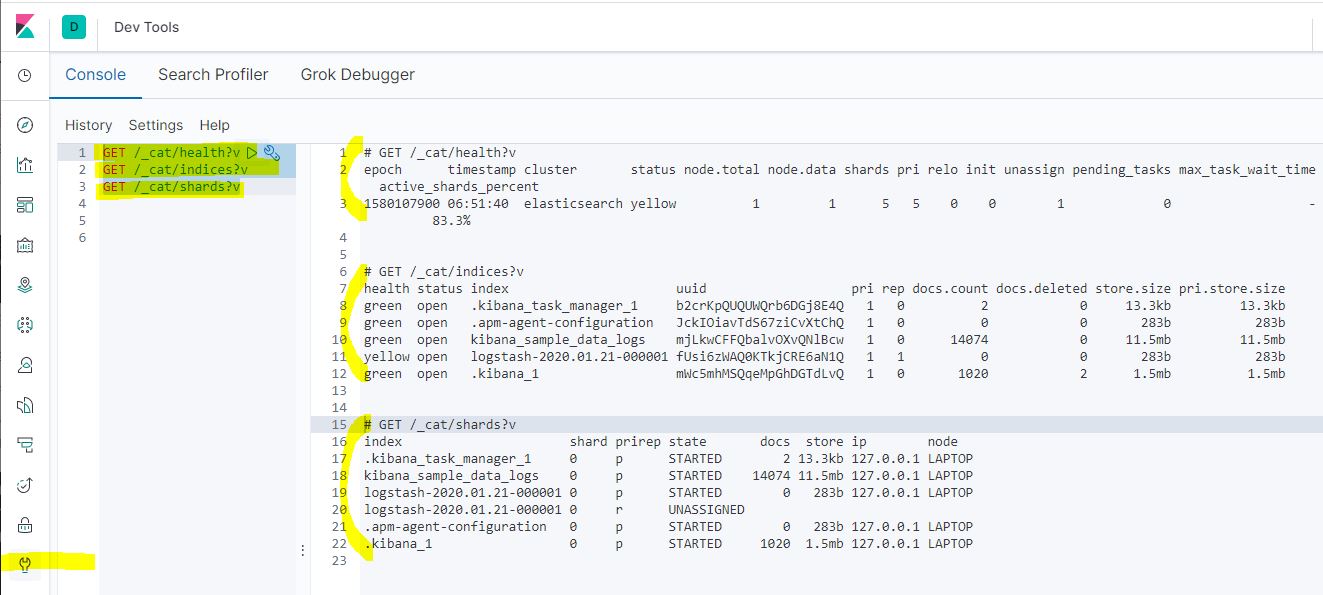
- Dev Tools를 이용한 query : 아래 명령어 쓴 후
click send to request
- cluster status : GET /_cat/health?v
- index status : GET /_cat/indices?v
- shard status : GET /_cat/shards?v
Status의 색깔별 의미
- Green : 모든 shard가 정상적으로 동작. 모든 index에 데이터 읽기/쓰기가 정상적
- Yellow : 일부 혹은 모든 replicas shard가 비정상적으로 동작. 읽기/쓰기는 정상적이지만, replicas가 없는 primary shard에 문제가 생기면 데이터 손실 가능성이 있음.
- Red : 일부 혹은 모든 replicas shard가 비정상적으로 동작. 읽기/쓰기조차 비정상적이며, replicas가 없는 primary shard에 문제가 생기면 데이터 손실 가능성이 있음.
- 참고자료
Status가 Yellow/Red일 때 해결법
- 상황
- cluster 이름 : kibana_sample_data_logs
- status : yellow
- 전체 node 수 : 1개
- data node 수 : 1개
- 전체 shard 수 : 5개
- primary shard : 5개
- relocation shard : 0개
- initializing shard : 0개
- 어떤 node에도 배정되지 않은 unassigned shard : 1개
-
확인법 : index status 및 shard status를 차례로 확인하여 문제가 있는 shard 가 무엇인지 찾기
-
확인결과 : “logstash-2020.01.21-000001”라는 index에 primary shard 하나와 replica shard 하나가 있는데, 그 중 replica shard가 unassigned 되었다.
-
문제원인 : replica shard는 primary shard가 저장된 노드가 손실되었을 때에 대비하여 다른 node에 shard를 복제해두는 것. 그런데 node가 하나 뿐이니 replica를 배정할 수 없다.
-
올바른 해결법 : node를 추가한다. 하지만 node를 설정하기 위한 elasticsearch.yml을 서버당 하나씩 놓을 수 있기 때문에 쉽지 않다.
- 쉬운 해결법 : dev tool에서 아래의 명령어를 입력하여, replica shard를 갖지 않도록 cluster setting을 변경한다.
PUT /logstash-2020.01.21-000001/_settings    #index name은 상황에 따라 변경
{
    "index" : {
        "number_of_replicas" : 0
    }
}
# 참고 : https://www.elastic.co/guide/en/elasticsearch/reference/current/indices-update-settings.html
ES status 확인
-
Kibana>Management>Elasticsearch하위Index Management에서 Health 색깔 확인 - 크롬 브라우저 주소창에 입력
- cluster status : http://localhost:9200/_cat/health?v
- index status : http://localhost:9200/_cat/indices?v
- shard status : http://localhost:9200/_cat/shards?v
- Dev Tools를 이용한 query : 아래 명령어 쓴 후
click send to request- cluster status : GET /_cat/health?v
- index status : GET /_cat/indices?v
- shard status : GET /_cat/shards?v
Status의 색깔별 의미
- Green : 모든 shard가 정상적으로 동작. 모든 index에 데이터 읽기/쓰기가 정상적
- Yellow : 일부 혹은 모든 replicas shard가 비정상적으로 동작. 읽기/쓰기는 정상적이지만, replicas가 없는 primary shard에 문제가 생기면 데이터 손실 가능성이 있음.
- Red : 일부 혹은 모든 replicas shard가 비정상적으로 동작. 읽기/쓰기조차 비정상적이며, replicas가 없는 primary shard에 문제가 생기면 데이터 손실 가능성이 있음.
- 참고자료
Status가 Yellow/Red일 때 해결법
- 상황
- cluster 이름 : kibana_sample_data_logs
- status : yellow
- 전체 node 수 : 1개
- data node 수 : 1개
- 전체 shard 수 : 5개
- primary shard : 5개
- relocation shard : 0개
- initializing shard : 0개
- 어떤 node에도 배정되지 않은 unassigned shard : 1개
-
확인법 : index status 및 shard status를 차례로 확인하여 문제가 있는 shard 가 무엇인지 찾기
-
확인결과 : “logstash-2020.01.21-000001”라는 index에 primary shard 하나와 replica shard 하나가 있는데, 그 중 replica shard가 unassigned 되었다.
-
문제원인 : replica shard는 primary shard가 저장된 노드가 손실되었을 때에 대비하여 다른 node에 shard를 복제해두는 것. 그런데 node가 하나 뿐이니 replica를 배정할 수 없다.
-
올바른 해결법 : node를 추가한다. 하지만 node를 설정하기 위한 elasticsearch.yml을 서버당 하나씩 놓을 수 있기 때문에 쉽지 않다.
- 쉬운 해결법 : dev tool에서 아래의 명령어를 입력하여, replica shard를 갖지 않도록 cluster setting을 변경한다.
PUT /logstash-2020.01.21-000001/_settings #index name은 상황에 따라 변경 { "index" : { "number_of_replicas" : 0 } } # 참고 : https://www.elastic.co/guide/en/elasticsearch/reference/current/indices-update-settings.html